With the widespread use of various batteries, fast charging technology has attracted widespread attention. The traditional charging method has a long charging time, and since the charging process is too simple, the battery life is shortened, so it has been eliminated. Accordingly, some new fast charging methods have begun to emerge and have been used in production practice. At the same time, the development of charging power supply is also very rapid. In the field of high-power charging, switching power supply has developed rapidly and has gradually replaced the traditional phase-controlled power supply. In this paper, the fast charging technology is discussed from the perspectives of fast charging principle, charging method, charging power supply and charging control.
1 fast charging principle
There are many types of batteries, and the most widely used ones are sealed lead-acid batteries and nickel-cadmium batteries. The charging and discharging principles of the two types of batteries are the same, that is, the positive and negative ions are generated by a chemical reaction to form a current.
The battery generates oxygen during charging and discharging. In the sealed battery, the oxygen generated by these positive electrodes can be absorbed by the negative electrode through the diaphragm and the gas chamber, and the entire chemical reaction forms a cyclic reaction form. In the case of a sealed battery, its internal pressure is limited, so the absorption speed of the negative electrode is also limited. If the charging voltage is too high, the rate of oxygen generated by the positive electrode is too fast, and the absorption speed of the negative electrode cannot keep up with the speed of oxygen generation. After a long time, the battery will be dehydrated, thereby inducing the micro-short-time sulfation of the battery and the like, and damaging the battery. Quality, shortening its service life. At the same time, the polarization of the battery during high-rate charging causes the internal pressure of the battery to rise, the battery temperature rises, and the internal resistance of the battery rises, which not only shortens the battery life, but also may cause permanent damage to the battery. The principle of this chemical reaction of batteries is fundamental to the study of rapid charging methods. On the one hand, fast charging should speed up the chemical reaction of the battery to maximize the charging speed; on the other hand, it must ensure the absorption capacity of the negative electrode so that it can keep up with the speed of the positive oxygen generation, and at the same time eliminate as much as possible. Polarization of the battery.
There are two ways to improve the chemical reaction speed of the battery. One is to improve the structure of the battery to reduce its internal resistance and increase the diffusion speed of the reactive ions. The second is to improve the charging method of the battery. In this paper, the charging method is mainly discussed.
2 charging method
Different types of batteries have different charge and discharge curves, and their corresponding charging methods are also very different. When studying a specific charging method, take this into account to select the appropriate method. Taking a lead-acid battery as an example, the conventional charging method (constant current charging or constant voltage charging) has been basically eliminated due to its drawbacks. The current charging method mostly makes its charging curve simulate the optimal charging curve of the battery as much as possible. In the mid-1960s, the American scientist JAMAS proposed the acceptable charging current curve of the battery with the lowest outgassing rate. That is, the charging current that the battery can accept at any time is I=I0expAt where: I0 is the initial charging current. ; A is the charge acceptance ratio; t is the charging time.
Figure 1 shows the optimal charging curve for a battery. It can be seen that the charging current decreases exponentially with time.
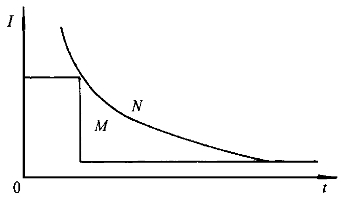
Figure 1 Optimal charging curve of the battery
1) If the charging current works in the N zone, the current is too large, which will lead to temperature rise. When the charging voltage is too high, a large amount of gas will be deposited, which will cause damage to the battery.
2) If the charging current works in the M zone, it is acceptable, but the charging time cannot be minimized.
3) If the charging current varies along the curved track, it is an ideal state of charge. Experiments have shown that if the charging current changes according to this curve, the charging time can be greatly shortened, and there is no influence on the capacity and life of the battery. This charging curve is the optimal charging curve.
The basic idea of ​​the grading constant current charging method and the pulsating charging method is to make the charging curve simulate the optimal charging curve as much as possible. 2 is a charging graph of a three-stage charging method in a grading constant current charging method, and FIG. 3 is a pulsating charging graph. In the current market of battery chargers, the grading and constant current charging method has been widely used. The pulsating charging method mostly adopts a combination of a pulse charging method and a grading constant current charging method, and divides the charging process curve into several segments, each of which adopts constant current pulse charging or constant voltage pulse charging.
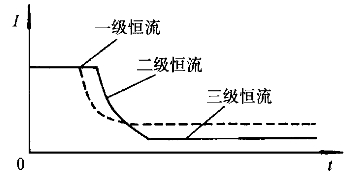
Figure 2 Three-stage charging method of the battery 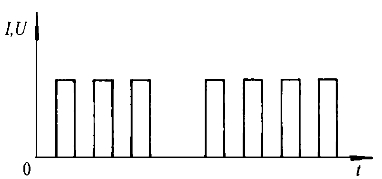
Figure 3 Battery pulse charging method
Professor Chen, a professor of Xiamen University, has proposed an intermittent charging method in the past two years. It is characterized by changing the constant current charging section to a voltage limiting variable current intermittent charging section. The constant current charging section in the early stage of charging uses the optimal charging current to obtain most of the charging amount; after charging, the fixed voltage is used to obtain the overcharge amount, and the battery is restored to the fully discharged state. Fig. 4 is a charging curve of a fully discharged state battery (with a state of charge of 0) having a voltage of 6 V and a capacity of 4 Ah using a variable current intermittent charging method. This curve visually shows the process of intermittent charging of variable current.
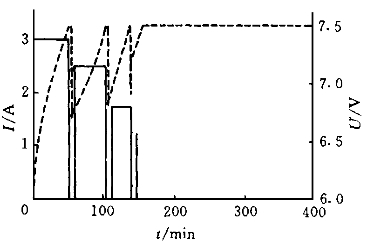
Figure 4 variable current intermittent charging curve
Based on the intermittent charging of the variable current, the author proposed a variable pressure intermittent charging method. The charging method is to change the variable current in the intermittent charging of the variable flow into a variable pressure, and intermittently stop charging, so that the oxygen generated by the chemical reaction of the battery has time to be recombined and absorbed, thereby reducing the internal pressure of the battery, so that the battery can be Absorb more electricity. The transformer charging is more in line with the optimal charging curve of the battery. This is because:
1) The capacity of the battery has been greatly supplemented after the use of large voltage and constant charge. When the battery is recharged, the same voltage is used for constant charging. The receiving capacity of the battery itself has been limited, and the charging efficiency will decrease. Constant charging with a voltage lowering one level is equivalent to charging with a current that is optimal for the current receiving capacity when the battery has been reduced in acceptability, so the charging effect is clearly the best.
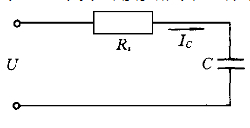
Figure 5 equivalent model of the battery
2) When studying the charging dynamics, the battery can be approximated as a large capacitor and a small resistor, represented by the simple model of Figure 5. Where: U is the charging voltage and IC is the charging current. ICRs+UC=U where IC=CdUC/dtUC=a+bexp(-t/T) then IC=dexp(-t/T) where: a, b, d are constants; T is a time constant, T=RsC. During constant voltage charging, the battery equivalent internal resistance Rs is approximately constant, and the charging current is attenuated exponentially. Figure 6 is a graph of variable voltage intermittent charging, as can be seen in comparison with Figure 1, this charging curve can fully simulate the optimal charging curve. The test results verify that this charging method can effectively improve the speed and efficiency of charging.
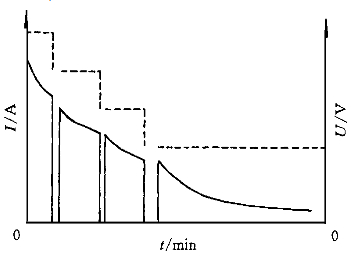
Figure 6 Variable voltage intermittent charging curve
3) From the engineering point of view, constant pressure control is easier to achieve.
3 charging power supply
There are many charging integrated circuits on the market, but most of them are for low-power chargers. High-power chargers need to design corresponding charging power supplies. The traditional charging power supply is mainly a phase-controlled power supply, because the power frequency transformer is included to cause a large volume of the power supply itself, and the power loss is also large. Due to the high switching frequency, the switching power supply has the characteristics of small size, light weight, low loss and high efficiency. Switching power supplies are developing very rapidly, and their applications are becoming more widespread, with the trend of gradually replacing traditional power supplies. According to the requirements of the system, the author designed a high frequency switching power supply of 30 kHz as the charging power source. The losses in the high-frequency power supply mainly include conduction loss, switching loss, cut-off loss and core loss, among which conduction loss and switching loss occupy a large proportion. In order to effectively reduce switching loss and conduction loss, the IGBT is selected as the power switching tube. IGBT is a new type of composite device. It combines the advantages of bipolar power transistors and MOSFETs. It has the advantages of voltage type control, high input impedance, low driving power, simple control circuit and large component capacity. The drive circuit of the power switch tube selects the special IGBT drive integrated circuit EXB841, which is used to drive the special drive chip of large-capacity, high-speed IGBT (capacity is 300A, 1200V or less, frequency below 40kHz); it is amplified part, over-current protection part And 5V power reference part. The overcurrent protection section implements overcurrent detection and delay protection to provide +15V and -5V voltages to meet the positive bias required for IGBT turn-on and the negative bias required for turn-off.
In the system, a phase-shifted zero-voltage full-bridge inverter circuit is designed. The circuit schematic and waveform diagram are shown in Figure 7. This kind of converter is developed on the basis of both the constant frequency converter and the phase shift control resonant converter. It uses the leakage inductance of the transformer and the parasitic capacitance of the switching tube to achieve zero voltage. The phase shift control is used for each phase. The conduction of the bridge arms differs by a phase shift angle. The phase shift control chip used in the system is UC3875 produced by Unitrode of the United States.
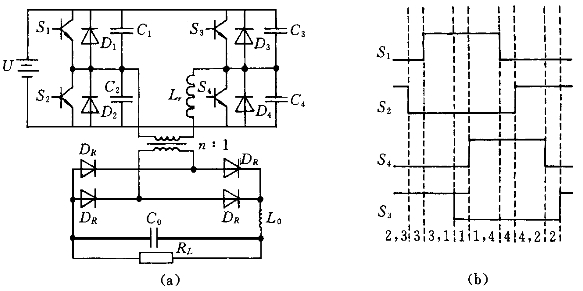
Figure 7 Full-bridge converter structure (a) and control waveform (b) of phase-shifted zero-voltage switch
Compared with the ordinary full-bridge circuit, a resonant inductor Lr is added to the circuit, and a capacitor Ci (i=1, 2, 3, 4) is connected in parallel to the four power switch tubes, and Ci includes the parasitic capacitance of the switching device. The control waveform of the switch tube is shown in Figure 7(b). The 3, 1, 4, and 2 segments are dead time. In addition to the dead time, there are always two switches in the circuit that are simultaneously turned on. There are 4 combinations: 2 and 3, 3 and 1, 1 and 4. 4 and 2; working again and again. The combination of 2 and 3, 1 and 4 is a full-bridge inverter circuit with output energy; 3 and 1, 4 and 2 do not output energy. By adjusting the time ratio of these two types of combinations, that is, adjusting the phase shift angle, the adjustment of the output signal can be achieved. The resonance of the circuit occurs in the dead time of the four combinations of mutual conversions, four times per switching cycle.
The difference of the parameters of the inverter circuit makes it easy for the bridge arm switches S1 and S2 with phase lead to achieve zero voltage conduction, and the bridge switches S3 and S4 with phase lag are not easy to achieve zero voltage conduction. This requires the selection of the corresponding inductor to meet certain conditions to meet the requirements of system resonance.
A power phase shift control test was performed (Fig. 8). The test results show that under the condition of a certain load, the phase shift control angle is adjusted from 0 to 180°, and the power supply output voltage can be linearly adjusted. When the phase shift control angle is 0°, the power supply output voltage is 0, and the charging power supply stops outputting current; when the phase shift control angle is 180°, the power supply output voltage and the input voltage are substantially the same, and the output voltage of the charging power source is maximum at this time.
The output waveform after passing through the power converter is shown in Figure 9(a), and the waveform after passing through the high-frequency transformer is the same. The waveform after rectification output is shown in Fig. 9(b), when the phase shift control angle is 90°, and the converter front DC voltage is 50V. In this case, the output voltage waveform is close to the duty ratio of 50%. wave.
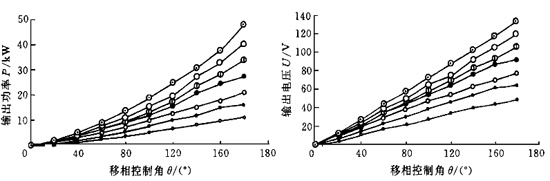
Figure 8 Phase shift control angle vs. output power and output voltage (a) Power converter output waveform (transformer secondary output waveform) (b) Power supply high frequency rectified output waveform 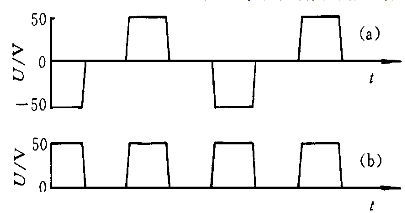
Figure 9 Output waveform in the test test
4 fuzzy controller structure design
The system uses a variable pressure intermittent charging method to change the charging and its intermittent process in a timely manner. The system collects the battery terminal voltage by controlling its charging intermittent process in real time. When the battery reaches the predetermined stop charging voltage, the charging is stopped and intermittently for a predetermined time, and then the system adjusts to the charging process of the next stage. In the constant voltage charging process, the fuzzy control method proposed by the author is adopted, that is, in each constant voltage stage, fuzzy inference is performed according to the change of the input variable, and the variation of the output variable is determined to keep the charging voltage constant.
The basic structure of the fuzzy controller is shown in Figure 10. The error e of the battery terminal voltage and the error change rate e? are selected as the input amount of the fuzzy controller, and the phase shift control angle is selected as the output variable. The system collects the terminal voltage of the battery in real time, calculates the error and error change rate, judges the state of the battery after the conversion, performs fuzzy reasoning, and then clears the control quantity U, and adjusts the size of the phase shift control angle. You can adjust the size of the charging voltage. The entire design process consists of three parts: precise fuzzification, fuzzy reasoning and clearing of control quantities.
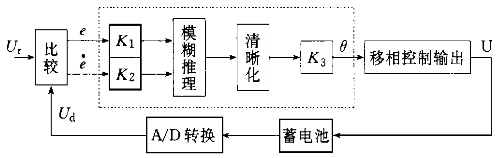
Figure 10 Basic structure of the battery fuzzy controller
For precise fuzzification, an explanation is given here. The error e (e=Ur, Ur is a given voltage) and the error change rate e of the battery terminal voltage Ud are selected as the input variables of the fuzzy controller, and the phase shift control angle is used as the output linguistic variable of the fuzzy controller. Since the error and error rate of change actually vary widely, they need to be converted into fixed areas. The terminal voltage is always in the rising phase during the charging process, so the range of e is only selected as the positive half; considering that the error rate is large when the gas is close to the gas outlet point, the fuzzy linguistic variable can be considered to increase the PVL (the forward direction is very large). Variety). Therefore, the language variables of e are selected as PS, PM, PL, PVL; e? language variables are selected NS, ZE, PS, PM, PL, PVL. According to the actual situation, the quantization factor of the input linguistic variable is determined, and the scale factor and the membership function of the linguistic variable are output.
5 Conclusion
The determination of the fast charging method is closely related to the charging effect. When designing the charging system, it is necessary to determine the appropriate charging method according to the charging object and system requirements, and at the same time select the corresponding charging integrated circuit according to the system requirements, or design the corresponding charging power source and Charging circuit.
Win 3 Portable Dust Monitor is a robust monitor with wisdom software that makes dust monitoring easy:
Measures PM1, PM2.5, PM4 and PM10 Continuously
Data Logging and Downloading of Real-time and TWA Values for All Particle Sizes
Purpose designed for mines
Audible Alarm Greater than 85dB
Colour Coded Omni-directional Visual Alarm
Intuitive, user-friendly software
Ultra Wide Band Technology, can Receive Warning Messages from other devices, for example Gas Detector, which make the operation more safe and confortable.
Dust Monitor
Dust Monitor,Dust Detector,Dust Detection,Dust Measuring
ZHEJIANG HUACAI OPTIC-TECHNOLOGY CO LTD , https://www.win3safety.com